Fivesight Research released a
study on “US Consumer Search Preferences Smartphone & Desktop: Q1 2017,” that states that Siri is the most used mobile “search engine” of choice after Google. The study was based on a survey of 800 US adults split roughly evenly between iOS and Android users.
Google has been the most used mobile search engine since years. This year it holds an 84 percent aggregate share among respondents. Among Android users, Google’s search share was 90 percent. Among iPhone owners Google had a 78 percent share. After Google, however, Siri was named by more respondents as their “primary search engine” than Bing or Yahoo. (However, this doesn’t reflect query volume, just identification as the primary engine of choice.)
Fivesight Research provided a comparative study given below, that reveals that Siri had a larger share of mobile search than Bing or Yahoo.
Siri was the primary search engine of 13 percent of iPhone owners. This finding is significant because it suggests the long-term, potentially disruptive impact of voice and virtual assistants on traditional “query in a box” results. It’s important to point out, however, that these responses reflect self-reported data and many not line up one-to-one with behavior.
Siri was also the most widely adopted virtual personal assistant among the available choices, used by a higher number of iOS users than “Google Now” was by Android users. Google Assistant wasn’t one of the available choices on the survey.
A very large percentage of respondents (72 percent) said they were using virtual assistants to “supplement” more traditional mobile search.

The survey also found that Chrome was the dominant mobile browser, with a 48 percent share, followed by Safari, with 37 percent. Roughly 14 percent of iPhone owners used Chrome as their primary browser. However, Android owners reported a higher level of non-Google browser use, with 11 percent choosing a Microsoft browser and another 10 percent using “other.”


![The Types Of Social Interactions [Infographic]](https://blogger.googleusercontent.com/img/b/R29vZ2xl/AVvXsEjqWwCwnwyOuigzJNDV4JKQKmUvBOG77p-gzMXON1AfumMuEc6r-UjEcRzGICV-26ROjywyEG226zhBxsQ5LxsUJluzWuakal3Hm8MuOLNxUoSzB_iaVFpLL4_259jMXFUcuzV9A_3ZkG7I/s640/social-media-interaction.png "The Types Of Social Interactions [Infographic]") People believe more on online reviews to assess local business. Here are the do's and don'ts for social interactions.
People believe more on online reviews to assess local business. Here are the do's and don'ts for social interactions.![The Types Of Social Interactions [Infographic]](https://blogger.googleusercontent.com/img/b/R29vZ2xl/AVvXsEjqWwCwnwyOuigzJNDV4JKQKmUvBOG77p-gzMXON1AfumMuEc6r-UjEcRzGICV-26ROjywyEG226zhBxsQ5LxsUJluzWuakal3Hm8MuOLNxUoSzB_iaVFpLL4_259jMXFUcuzV9A_3ZkG7I/s1600/social-media-interaction.png "The Types Of Social Interactions [Infographic]")

![Which Social Networks Should You Care About In 2017 [Infographic]](https://blogger.googleusercontent.com/img/b/R29vZ2xl/AVvXsEhsVnqmVguA3vIIJAIgNUyUtfar7GkdmKiwE92kAoULfgsYyWG_PhxHgTtSkyp9EwyPepGa9htJ7twwAGapGSNHoM6ZKxGro60f-uB2FRnba6Fg3hI0ZOBttH3qo72RbyOKmra00XqkMoNg/s1600/which-social-media-you-should-look-into.png "Which Social Networks Should You Care About In 2017 [Infographic]")

![Social Media Trends in 2017 [Infographic]](https://blogger.googleusercontent.com/img/b/R29vZ2xl/AVvXsEj0PeM0o21r0G12KMg0mJNYv2u-sUPV23ePN48nGdR14WIkmywKBjW3RJFIZ3Eu_IUjN9SKzyqCU_aLNFGAw9XcwNtdEwg_LTrHtSm5Za6rI2TxFYIRkDjFqy8dbdqpacCzBtXJoCPv5E2m/s1600/top-8-trends-in-2017.png "Social Media Trends in 2017 [Infographic]")

![How Google Works [Infographic]](https://blogger.googleusercontent.com/img/b/R29vZ2xl/AVvXsEhhxrqe9ZZqPOHwQwZs1xZ9g26ciwogB86jcb3oFtobDlBX1MMxbp4Lg-s5OmDWkXz9a4wRmYbbBFh7CubLSy08aXLKlwlpuyyvXLPXJsF4KkGumVMZYIREOfA0uQ1L13GLDIv92siLQU9V/s640/how-google-works.jpg "How Google Works [Infographic]")
![How Google Works [Infographic]](https://lh3.googleusercontent.com/blogger_img_proxy/AEn0k_sTtDDhJ3ZJfSKrgPX_YSkZkR__jIvCS73UQ7VqSpzd23hFrBkI_vO03scqkylPmEfOOeIgYZmnb-QD2hUGb2hAmZMUOxEQSNTYJzWZUR0y9ZlLzZcY-llCUWb_=s0-d)

![Growth Of Internet Usage And Its Effect on Human Brains [Infographic]](https://blogger.googleusercontent.com/img/b/R29vZ2xl/AVvXsEjLmkyyOC084kr3Ll796r7tOQ9hJVz3LsfxtaCKyz8k77J6OyVSqDPN0m1rvF6AVpn5Vr2LqTptz49gWEuAzfCyKQWaamDV4y-iiM98Vhm77yF12itgKEFTeYdTLn_WyCWfRx8CzlR0u6rE/s1600/internet-side-effects-on-human-brains-and-internet-statistics-worldwide.png "Growth Of Internet Usage And Its Effect on Human Brains [Infographic]")

![200+ Ways To Make Money Online [Infographic]](https://blogger.googleusercontent.com/img/b/R29vZ2xl/AVvXsEgV-k3HWz5y8sZnaQOxLWCF51f5omlW_E7L2OIVPzxfyYyLXC8AhVgN24Ru79ynxDe2ueYWUOcvMcTLHxx3-Sv9TnMy0ple05eQbKdaGjpMoNQJRBRHAqw9BaD3KQHb706Ex6bxJfiIQe4m/s1600/200%252B-ways-to-make-money-online.png "200+ Ways To Make Money Online [Infographic]")

![How Video Marketing Works [Infographic]](https://blogger.googleusercontent.com/img/b/R29vZ2xl/AVvXsEhoVwVWT7nQoH6PmGDBkxhXqFut3Mr3u7gwcY_oO9g9Unb6ST3G80swX0RKN9s9oXaVDrbZUMj-zxxdZASccVsUE-fujA4YDalKxRQzPjy7iIH6O6Icfi6n6IfpLgLGnBICF8aGbUDbSzhy/s1600/how-video-marketing-works-127-facts.png "How Video Marketing Works [Infographic]")

![Top Social Media Trends in 2017 [Infographic]](https://blogger.googleusercontent.com/img/b/R29vZ2xl/AVvXsEjALsqwM8WUljn86rjqTaU0xSco1gvcxUxd6PJArMMLevYhfJYTmdedZi5mZfnWvxWbwn6xxZi-Y5k7u_GbN_mxMmmdATGlM97M2IlmkRZDP1ziQqgBixz1by4EXeaHD_IrgmcvEG7NWZ1Y/s1600/social-media-trends-2017.png "Top Social Media Trends in 2017 [Infographic]")
![How to Use Google Plus for Marketing [Infographic]](https://blogger.googleusercontent.com/img/b/R29vZ2xl/AVvXsEghIiH0Lof1Z-GuiviAW_BTBrFjOXsuJfbA84URDETyu23V4Sl3PH2JDH3vNU-ARPPOV8iGKN-bmQEwK_iJIarUB1V3VnfOxZwK0s8JKGOjps2lUAkiQkGV3HHRS5ieTpks22AGYCfy2UGk/s1600/how-to-use-google-plus-for-marketing.png "How to Use Google Plus for Marketing [Infographic]")

![The Art Of Deceptive Advertising [Infographic]](https://blogger.googleusercontent.com/img/b/R29vZ2xl/AVvXsEixPtXwddym5ahAanTGzqjFGWrrwt_W2pIrbso4Hr22KC7DTtFlkPC9vfHnaUyTgax1bpRQkZq7Dy1SUhfDNFA8AgxcJd7xznXd-RAqCU2b3gNYqY3WDDTYYtKcYs6BkO1q53TjjPeRnic8/s1600/the-art-of-deception-in-advertising.png "The Art Of Deceptive Advertising [Infographic]")

![AWS vs Azure: An ongoing public cloud battle [Infographic]](https://blogger.googleusercontent.com/img/b/R29vZ2xl/AVvXsEiA7l7w0atN7AXcdDXD8g0RR2b0w-yIdux6KZqFSFHrzknK8v0tSp8zw37kjXUkW8p-8ZSDMuWv7tDjAVdTCGnKRb_WqNWtS5Ro2BIDWRrHu6KV6A8UJegq1OlHSOQdeVfSyLWLEphGI8V7/s1600/AWS-vs-Azure.png "AWS vs Azure: An ongoing public cloud battle [Infographic]")

![5 SEO Trends For 2017 [Infographic]](https://blogger.googleusercontent.com/img/b/R29vZ2xl/AVvXsEjrd2HT1vkn6ASJgtNyHoTWh6r2uEgiDGmmP6bmgPxkeZYMPon6zxHW_YCmssT6bGIhMvM-r00jIdb-QhhIDTm8q8e4xSngfcAV5gB5-2OlvPXdUihfY1p_wzAINj1bCsWJmInNvbIK86oJ/s1600/SEO-trends-in-2017.png "5 SEO Trends For 2017 [Infographic]")

![Social Media Trends & Facts 2017 [Infographic]](https://blogger.googleusercontent.com/img/b/R29vZ2xl/AVvXsEjoMX4_RVHruobLIUVpga3FEocxkDZ6LoDVhICSbXAp2Ra85cLSMpXlox7vwMhB47uMNPbVEtziPHOf25vW0q3CWmprAGSCxDpOtDOiid7DcbznxpLv-It51qaUY4yXoMBkBo2T25YNT074/s1600/facts-trends-about-social-media.jpg "Social Media Trends & Facts 2017 [Infographic]")

![iPhone 8 Rumours & Gossips [Infographic]](https://blogger.googleusercontent.com/img/b/R29vZ2xl/AVvXsEhQYazIXdmWuB5nL6-3fvQ6zC5hp2u7svreqdifwR5wl74TsP8LU_J-KqyiLcdWOutICYnoUVaZ982-bCPEO35gsvZUTXnT_xgh6AVUclTzQjB9jGFOk8wxtrRi_UyJoQcUDTl2xNt8Mn_q/s1600/iPhone-8-Rumor.jpg "iPhone 8 Rumours & Gossips [Infographic]")


![Social Media Ranking [Infographic]](https://blogger.googleusercontent.com/img/b/R29vZ2xl/AVvXsEgHsiHi-An4Oqm4Qbc7KsRUkCLTSVwsjAwqSbcMC5yxuZBmUBak-L4b62u9CJz12KrRZaH71-jWfCjRat7ohBsc674yuTG9txEo8yKcZTZs6ZKN6gNtbfNyPB_tD3271BLmAk6Sr267xAII/s1600/top-social-media-ranking.png "Social Media Ranking [Infographic]")

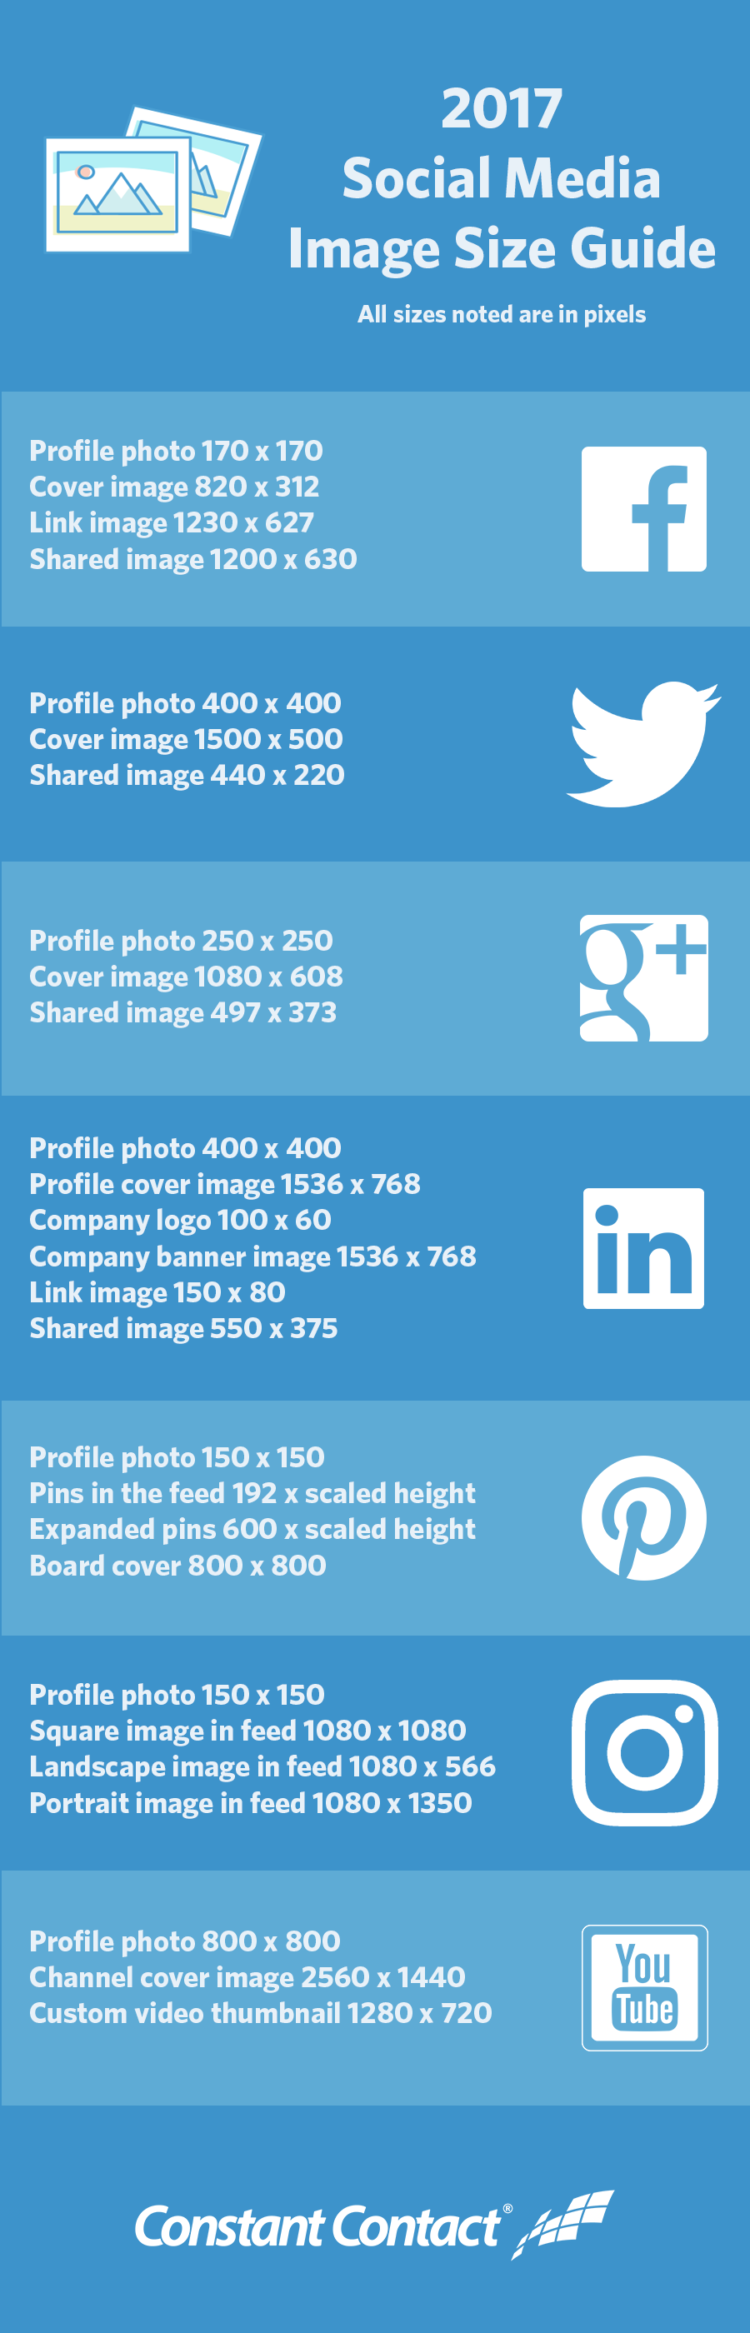
![Social Media Image Sizes Guide 2017 Infographic]](https://blogger.googleusercontent.com/img/b/R29vZ2xl/AVvXsEhJ-WFA3C-LC1dNAiB9H0kb0X_J-vMFu5B9eFzMMvzF29KnmSIRW-XPNHrGBfvbBx9-_8qcj4Pnptn05JvMLDJbRfTBVL3EDcxvrE69nRNYddKmTUHYA4MEQQpEzXecQ00voiH8MyHEo0mB/s1600/2017-social-media-image-size-guide.png "Social Media Image Sizes Guide 2017 Infographic]")
![How Does A Mobile App Development Process Work [Infographic]](https://blogger.googleusercontent.com/img/b/R29vZ2xl/AVvXsEjsBJr0VpnFDhmJrZt116AY7zMwYotWWzFAR7Hf1bzLQ6cOTCS-HKRkhwfKvopi8lYoFIBxnRu10vBQRBjD50YCqLUyMQHdH5e11wgkeykeTLyx7x886-rNwVO0i43e0O831nEtgSntllqM/s1600/how-does-a-mobile-app-development-process-work.jpg "How Does A Mobile App Development Process Work [Infographic]")


 Recent
 Tags
Tags Popular


